Research projects in Lanekoff Group
We are working on several projects where we develop mass spectrometric techniques to detect, characterise and quantify the chemical constituents of various complex samples. Our strategy is to connect the sampling step with different separation and analysis techniques. By systematically moving the sampling probe over the sample, for example a thin tissue section, we can create pictures of how the presence of different molecules differs between different parts of the sample. In other words, we are not only interested in what is in the sample, but also where the different components are located. The challenge lies in designing small sampling probes to enable high-precision sampling from very small areas and thus obtain a high spatial resolution of our images, as well as to increase the sensitivity of the analytical methods that we use to be able to analyse the small amounts of sample material that these tiny probes generate. Our progress in this area has now led us to develop methods for single cell analysis.
Nano-DESI
Nanospray desorption electrospray ionisation, nano-DESI, is a method for mass spectrometry imaging. The method is based on localised desorption of molecules from a surface by liquid extraction. A thin jet of continuously flowing solvent hits the surface at a specific point, where molecules are extracted from the sample into the solvent which subsequently transports the molecules to the inlet of the mass spectrometer for electrospray ionisation and detection. Ion images showing the distribution of a specific molecule are created by moving the sample under the nano-DESI probe while continuously acquiring spatially resolved data.
We work on developments of the nano-DESI setup and modification to the solvent to achieve a quantitative, sensitive, and tailored system to use for molecular mapping in thin tissue sections.
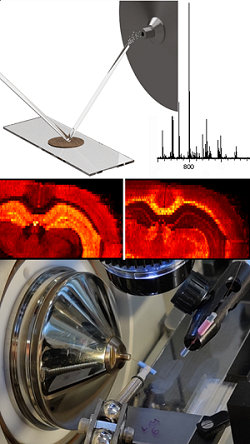
Schematic picture and photograph of nano-DESI, a mass spectrum of the phospholipid region and ion images of two phospholipids in brain tissue.
SS-CE-MS
Surface sampling capillary electrophoresis, SS-CE-MS, has been invented, and is now being further developed, in our group. SS-CE-MS is a system for direct sampling of molecules from a biological surface into a separation capillary for subsequent separation, ionisation, and mass spectrometric detection. This approach does not require any pretreatment of the sample and enables spatial omics of thin tissue sections.
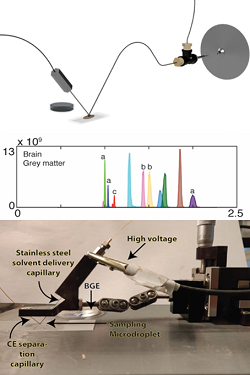
Schematic and photograph of SS-CE-MS, an electropherogram of metabolites in the grey matter of brain.
Molecular characterisation
Molecular characterisation with mass spectrometry includes using high mass resolving power with high mass accuracy for annotation. We extend this approach using MSn fragmentation techniques together with clever chemistry and data modelling for annotating isomers and isobars without time consuming separation.
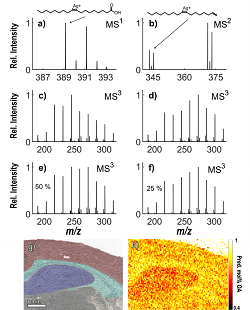
MSn spectra from the isomers vaccenic and oleic acid, optical image and ion image of their relative distribution in brain.
Single-cell analysis
Chemical analysis of individual cells is an analytical challenge due to the limited material available, but have great benefits for revealing cellular heterogeneity in health and disease. We develop mass spectrometric techniques for chemical omics analysis of individual cells.
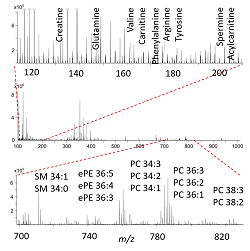
Mass spectrum from a single cell, annotation of selected metabolites and lipids.